 Zerodha (Trading & Demat Account)
FREE Equity Delivery and MF
Flat ₹20/trade Intra-day/F&O
 Zerodha (Trading & Demat Account)
FREE Equity Delivery and MF
Flat ₹20/trade Intra-day/F&O

|
|
Published on Monday, August 13, 2018 by Chittorgarh.com Team | Modified on Wednesday, November 13, 2019
Wonder how some traders can predict the market sentiment and pick profitable trades?
How to decide whether to buy a Call option or sell a Put option today?
Well there are some technical indicators and data that can help you predict which way the market will go and what option trades will deliver profits to you.
Technical analysis is a way of forecasting the near future by analyzing data like price trends, trading volume of stocks. And it's not rocket science. You don't need to be an expert to technically analyze stocks. There are some publicly available, simple and easy to understand technical indicators to help you predict market sentiment-
Put-Call Ratio: As options are derived from an underlying like stocks, nifty, commodities, and currency etc., so the price movements of an Option is directly related to price movements of its underlying. The price of an equity option is directly tied to the price of the stock. The put-call ratio is one of the indicators used to predict the options market sentiment.
How to calculate put-call ratio?
The put-call ratio is calculated by dividing the total number of put options traded in the options market over a period of time by the total number of call options. It is calculated on the Open Interest (OI) contracts or trading volumes.
Put-Call Ratio= Number of Put Open Interest/Number of Call Open Interest
Or
Put-Call Ratio= Put traded volume/Call traded volume
How to interpret put-call ratio?
A put-call ratio above '1' means that there are more sellers than buyers in the market while a ratio less than '1' indicates more buyers than sellers. In another way, an above '1' ratio means traders are bearish on the market while less than '1' indicates that traders are bullish on the market.
Daily Moving Averages (DMAs): The DMAs are a popular technical indicator to identify the direction of a particular trend. The prices don't move in a straight line. There are daily ups and downs. However, over a period of time, the price either is decreased or increased. The moving average is used to identify the trend of price movement over a period of time.
Moving Averages are of two types: Simple and Exponential. Both simple and exponential are similar except for the fact that in exponential added weight is given to the latest data. An exponential average is considered to be more effective in predicting recent changes in the market.
How to calculate Simple Moving Averages?
Suppose you want to calculate the simple moving average for closing price of HPCL for last 5 days-
|
Day |
HPCL Closing Price |
|---|---|
|
1 |
300 |
|
2 |
280 |
|
3 |
320 |
|
4 |
325 |
|
5 |
320 |
The average comes out to= 1545/5= 309
Now HPCL price moves to 325 on the 6th day. What will be the moving average for the last 5 days? To calculate the average you need to drop the value of day 1 and add the price for day 6 in the above calculation.
Suppose HPCL moves to 320 on the 7th day. What will be the moving average for the last 5 days? To calculate the average you need to drop the value of day 1 & 2 and add the price for day 6 & 7 in the above calculation.
|
Day |
HPCL Closing Price |
Last 5 day Average |
|
1 |
300 |
|
|
2 |
280 |
|
|
3 |
320 |
|
|
4 |
325 |
|
|
5 |
320 |
309 (Day 1-5) |
|
6 |
325 |
314 (Day 2-6) |
|
7 |
320 |
322(Day 3-7) |
|
8 |
310 |
320 (Day 4-8) |
|
9 |
315 |
318 (Day 5-9) |
|
10 |
325 |
319 (Day 6-10) |
The series of values you get in last 5-day average column is the moving average. It keeps on changing with each passing day.
How to calculate the exponential moving average (EMA)?
An exponential moving average is calculated as-
EMA= (Closing price -EMA (previous day)) * (2/(Time period+1) + EMA (previous day)
|
Day |
HPCL Closing Price |
Last 5-day Exponential Average |
|---|---|---|
|
1 |
300 |
|
|
2 |
280 |
|
|
3 |
320 |
|
|
4 |
325 |
|
|
5 |
320 |
91.43 |
|
6 |
325 |
158.16 |
|
7 |
320 |
204.40 |
|
8 |
310 |
234.57 |
|
9 |
315 |
257.55 |
|
10 |
325 |
276.82 |
Generally the moving average is followed for 200 days to identify a long-term trend and unless other factors are affecting the underlying, the trend follows.
The trend is considered up if the moving average is rising and vice versa. Moving average is also used in determining supports & resistance level.
Implied Volatility: It measures the expected rate in change of the prices of the underlying in the future. Implied volatility is dependent on supply and demand. High demand of a stock pushes up the price of a stock and thereby its implied volatility. And vice versa. Implied volatility is also dependent on events. You will see stocks becoming volatile when they are in news or ahead of major announcements like company results, acquisitions etc.
How to get Implied Volatility (IV) data?
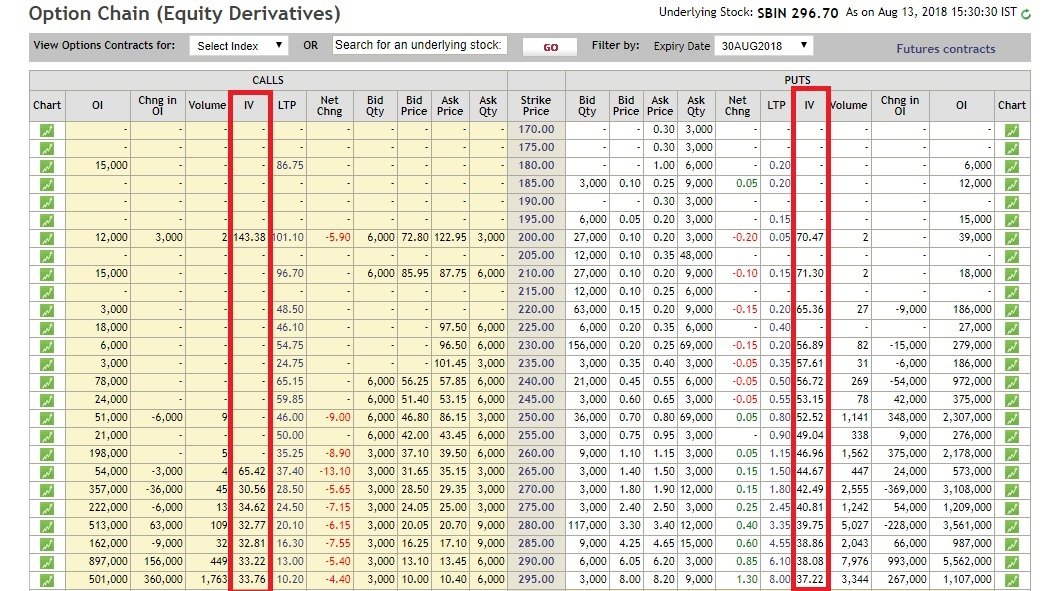
You can get Implied Volatility data from NSE and BSE website. Here's how to do it-
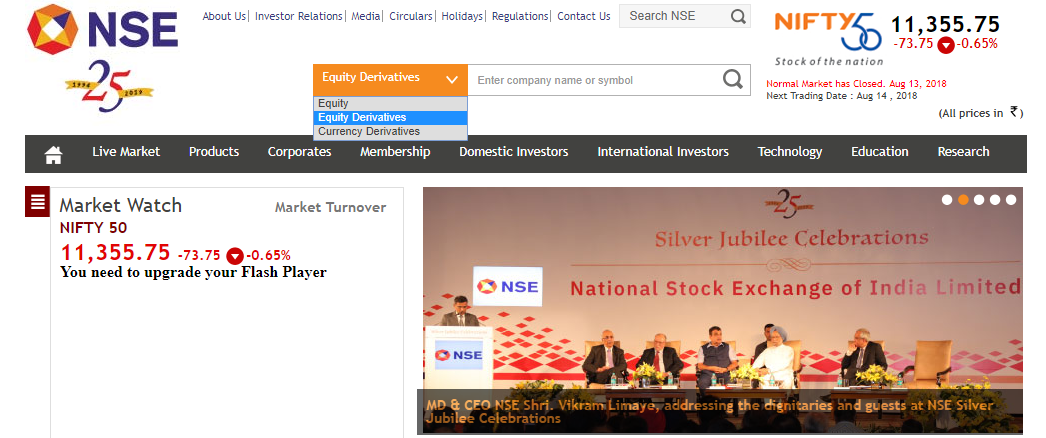
Go to www.nseindia.com and use the search bar. Select 'Equity Derivatives' and enter the name of the Nifty or Company you want data for.

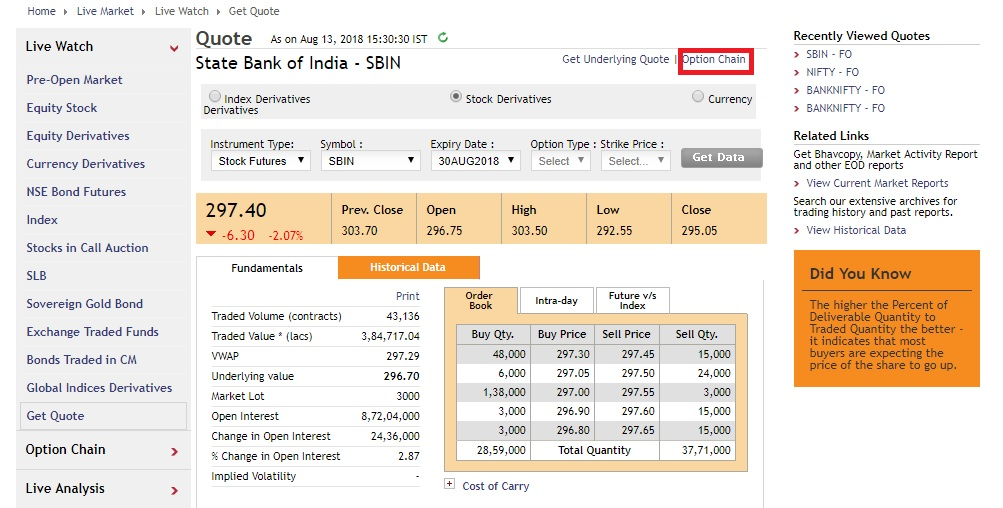
In the next screen, click on option chain


The common perception is that a high IV signals bearish market while a low IV means bullish market. However, you also need to take the historical volatility of the underlying into consideration while ascertaining whether the IV of a particular stock is high or low.
These three simple technical indicators will help you develop a view on the particular stock. However, it is best not to take anyone indicator in isolation to gauge the market mood. Once you have formed a view, you would need a strategy to benefit from the market sentiment. You can pick the right strategy from our Option trading guide. It lists 25 options trading strategies for bullish, bearish and neutral markets. You can also filter strategies based on your risk and reward profile and compare various strategies to pick the right one for you.

Add a public comment...

FREE Intraday Trading (Eq, F&O)
Flat ₹20 Per Trade in F&O
|
|