FREE Equity Delivery and MF
Flat ₹20/trade Intra-day/F&O
FREE Equity Delivery and MF
Flat ₹20/trade Intra-day/F&O

|
|
Published on Friday, June 1, 2018 by Chittorgarh.com Team | Modified on Tuesday, February 27, 2024
An option chain provides detailed information about the available option contracts for a specific underlying stock or index. In particular, it shows all available calls and puts on an underlying asset for a specific expiration date. The list of options is sorted by strike price, and data on premium, open interest, and implied volatility is displayed.
To an inexperienced options trader, an option chain chart can look like a complex maze of data. And it can be overwhelming to understand. If you look around forums and trading websites, you'll find that the options chain is the subject of much discussion and many traders ask questions like:
'How to read an options chain for stocks?'
'How to find the options chain?'
'How to analyze option chain charts?'
And so on.
The option chain is an important chart, full of important information that helps a trader make profitable decisions. If you want to make profitable option trades, mastering the option chain chart is necessary.
This article will help you understand the option chain, make sense of the various data available, and make the right trading decision.
Contents:
Option Chain Meaning
An option chain chart is a listing of the call and put options available for an underlying asset for a specific expiration period. The listing contains information about premium, volume, open interest, etc. for different strike prices.
Let's first look at what an option chain looks like and what data it contains. The NSE provides you with option chain charts for all trading options. So you need to find the option chain you want:
Visit www.nseindia.com and click "Market Data"
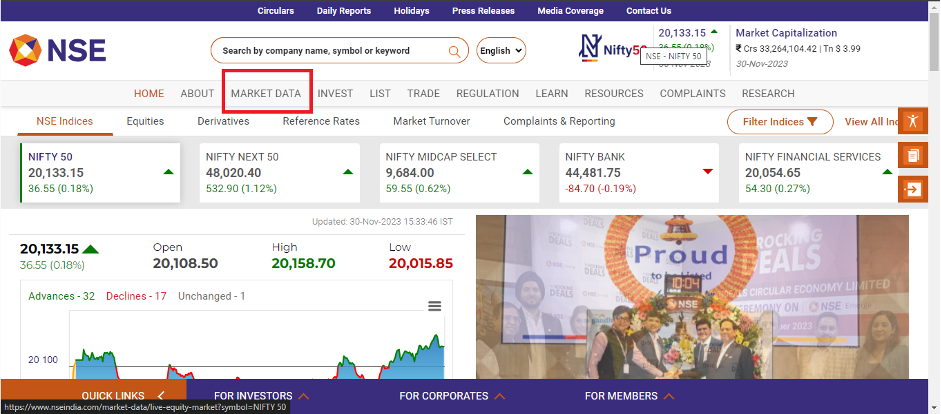
By clicking on “Market Data”, a drop-down will open, click on “Option Chain”:
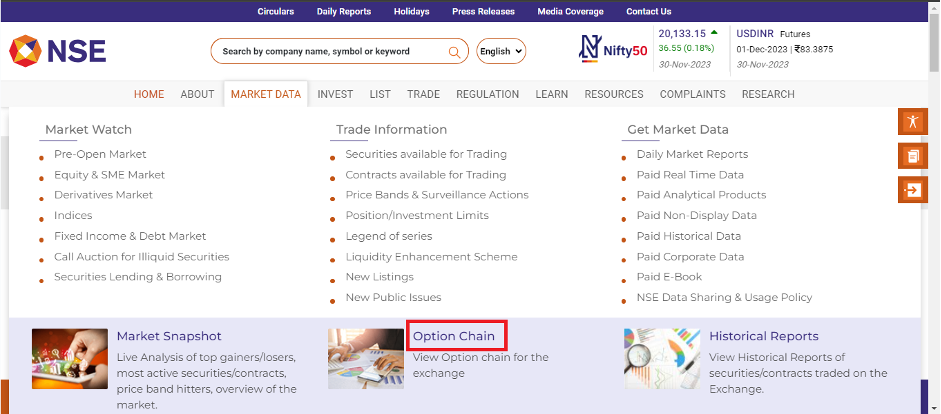
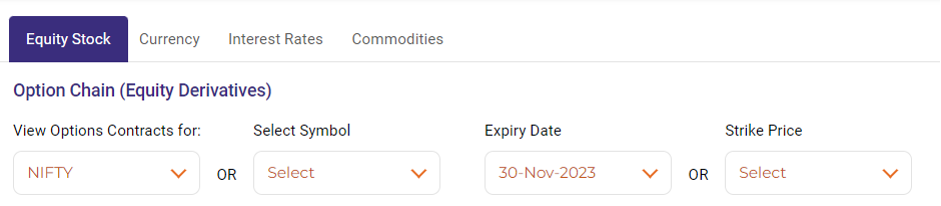
On clicking the options chain, this page will open

You can filter between "Option contracts" and "Select Symbol" to choose any stock option, filter by "Expiry date" or "Strike Price"
 >
>The chart is divided into call and put options. On the left side, there is data for call options, and on the right side for put options.
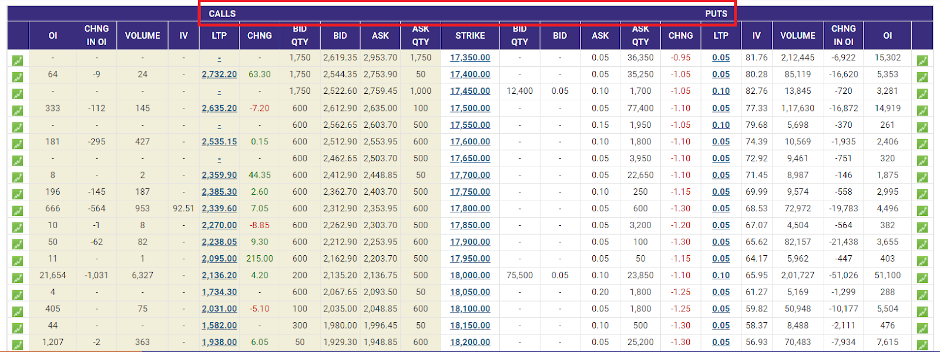
At the centre of the chart, we have various strike prices
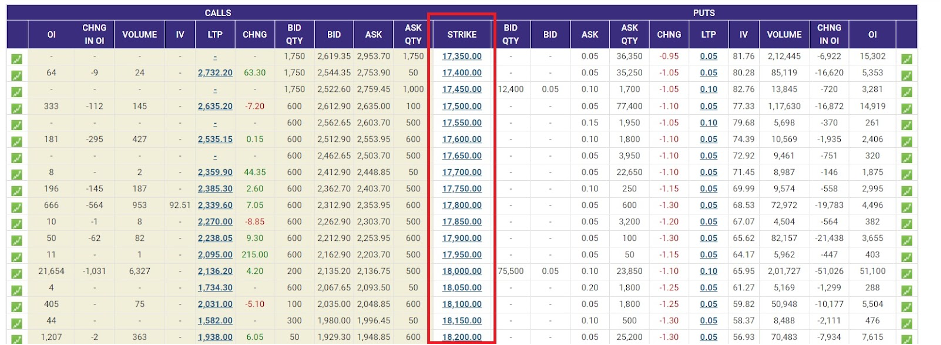
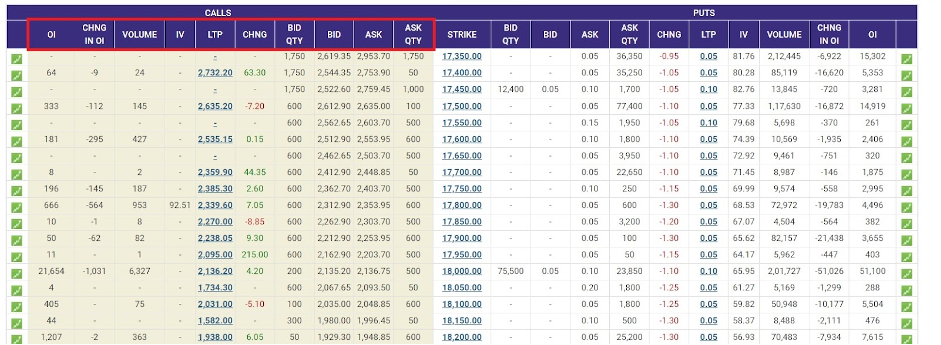
On both sides of the strike prices we have different data such as OI, Chng in OI, Volume, IV, LTP, Net Chng, Bid Qty, Bid Price, Ask Price, and Ask Qty
We also see that part of the data on both sides is highlighted in a light hue of yellow and the rest in white. The highlighted part is ITM options, while the non-highlighted part is the OTM options.
These are the different components of an option chain. Let us now understand each component in detail:
Options Type: There are two types of options: Call and Put.
A call option is a contract that gives you the right, but not the obligation, to buy the underlying asset at a certain price and within the expiration date of the option. Please remember that the contract gives you the right, but not the obligation, to buy the underlying asset. A put option, on the other hand, is a contract that gives you the right, but not the obligation, to sell the underlying asset at a specified price and within the expiration date of the option. Here too, the contract gives you the right, but not the obligation, to sell the underlying asset.
Click here to read more on Call & Put Options
Strike price
The strike price is the price at which you as the buyer and seller of the option have agreed to exercise the contract. Your options trade only becomes profitable when the price of an option exceeds this strike price. On both sides of the strike prices, we also have data such as OI, Chng in OI, Volume, IV, LTP, Net Chng, Bid Qty, Bid Price, Ask Price, and Ask Qty. let's understand what each of them means:
OI: OI is an abbreviation for Open Interest. It is data that signifies the interest of traders in a particular strike price of an Option. OI tells you about the number of contracts that are traded but not exercised or squared off. The higher the number, the more interest among traders for the particular strike price of an Option. Hence there is high liquidity for you to able to trade your Option when desired.
Chng in OI: It informs you about the change in open interest within the expiry period. The number of contracts that have been closed, exercised, or settled. A significant change in the OI should be carefully monitored.
Volume: It is another indicator of traders' interest in a particular option strike price. It provides information on the total number of contracts of an option for a specific strike price that is traded on the market. It is calculated daily. The volume can help you understand the current interests of traders.
IV:IV is an abbreviation for Implied Volatility. It provides information about what the market thinks about the performance of the underlying asset. A higher IV means the potential for strong price fluctuations, and a low IV means no or fewer fluctuations. The IV says nothing about the direction in which prices are moving, whether upwards or downwards.
LTP: It is the abbreviation for the Last Traded Price of an Option.
Net Chng: This is the net change in LTP. The positive changes, i.e. the price increase, are shown in green, while the negative changes, i.e. the price decrease, are shown in red.
Bid Qty: This is the number of buy orders for a specific strike price. It provides information about the current demand for the strike price of an option.
Bid Price: This is the price specified in the last buy order. A price that is above the LTP indicates that demand for the option is increasing and vice versa.
Ask Price: This is the price quoted in the last sell order.
Ask Qty: This is the number of open sell orders for a specific strike price. It provides information about the offer for the option.
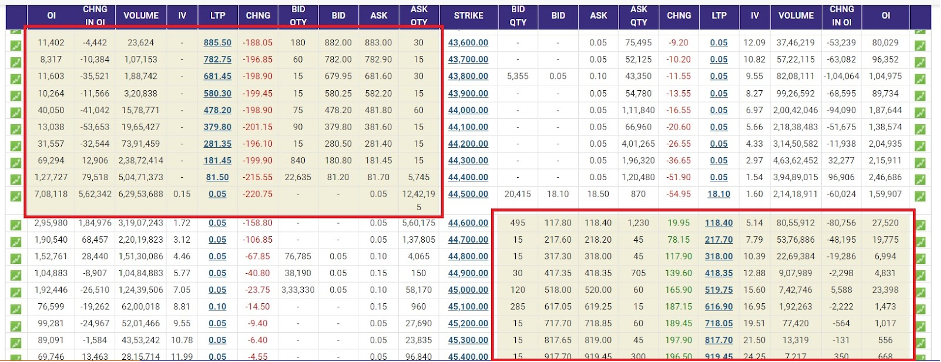
Now let's understand why part of the date is highlighted while the rest appears in white. To understand this, we first need to get to know ITM, ATM, and OTM.
In-The-Money (ITM): A call option is in ITM if its strike price is below the current market price of the underlying asset. A put option is ITM if its strike price is above the current market price of the underlying asset.
At-The-Money (ATM): If the strike price of a call or put option is equal to the current market price of the underlying asset, it is ATM.
Over-The-Money (OTM): A call option is OTM if the strike price is greater than the current market price of the underlying. A put option is OTM if the strike price is lower than the current market price of the underlying.
The highlighted part is in ITM, while the parts marked in white are OTM. For call options, exercise prices that are below the current price of the underlying are highlighted, while for put options, exercise prices that are above the current price of the underlying are highlighted.
A thorough study of the options chain can give you a lot of insight into an option and help you make an informed decision for your trade. So learn to read an option chain to make better trading decisions.
Open Interest (OI) is a number that indicates how many futures (or options) contracts are currently outstanding (open) on the market.
It is used to determine the future volatility of the share or index. Since futures and options are traded at a predetermined price in the future, implied volatility plays an important role in F&O transactions. Implied volatility is often used to value options contracts, with high implied volatility leading to higher premiums for options and vice versa.
Volume is a measure of the total number of shares or contracts traded in a day. On the stock market, the trading volume does not influence the number of shares traded. On the options market, however, the volume of a particular contract can lead to outstanding contracts either being opened or closed.
LTP stands for Last Traded Price. It displays the price information of all calls and puts. The premium amount that the buyer and seller agree on to enter into the trade is called the Last Traded Price (LTP) for options.
An option chain is a detailed representation of all available option contracts for an asset (stock, index, currency, commodity) and provides a quick overview of all available put options
it provides a quick overview of all available put and call options of the asset in question with their prices, volume, and details of open positions, which can be beneficial for a trader to analyze the market and take appropriate immediate action.
The options chain helps the traders to understand how the market would react at different strike prices.

FREE Intraday Trading (Eq, F&O)
Flat ₹20 Per Trade in F&O

|
|


My question is, why market went bullish and why didn't it go bearish even after so much buying is a 'Put'?